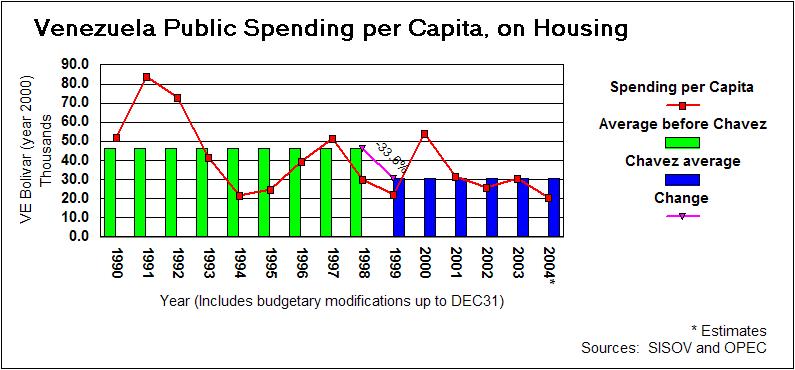
Other graphs depicting public spending on housing may misleadingly show lines with an upward slope. This is for failure to adjust for other factors. Namely, this graph uses constant Venezuelan Bolivar currency (year 2000), and adjusts for population growth, depicted by the long-line plot. The bars represent the average yearly public spending per capita on housing for the nine years previous to Hugo Chavez's administration, then for the six years of Chavez's administration.
The short-line plot emphasizes and quantifies what is visually clear from the bars: Chavez's administration has been spending only two thirds of what his predecessors were spending.
For Chavez's 2005 administration to make up for the difference and merely match what preceeding adminstrations were spending on housing, it would have to increase its 2004 spending by 1,130%! Unfortunately, referring back to the long-line plot, it is clear that as years go by Chavez's administration is decreasing an already small spenditure.
The spending numbers were found at http://www.sisov.mpd.gov.ve ; the population numbers were found at or extrapolated from http://www.opec.org

From the graphs on public spending and constructed homes one can assess intention and effectiveness, respectively. From this graph we can discard a lack of spending (i.e., caring) as the single cause for such dismal results. By dividing the amount spent by the number of units constructed, we get the long-line plot as a measure of (in)efficiency. It is worth noting that the spending is based on constant Venezuelan Bolivar currency (year 2000).
The bars represent the average cost of constructing a home for the nine years previous to, then for the six years of, Chavez's administration. The costs per unit are actually higher because the numbers, here, of completed homes include both public and private sector constructions, which in 2003 had a ratio of about 4:1.
The short-line plot emphasizes and quantifies what is visually clear from the bars: It costs Chavez's administration more than twice as much to build one home than what it cost preceding administrations.
The difference between averages would be even greater if it weren't for the later completion of some homes that were begun before Chavez's administration. Only this administration's first year, the year in which homes from previous administrations were completed, has a value within the range of values of the preceding administrations. All other years, Chavez's administration's numbers have been higher than the highest in nine previous years!
Besides the high cost per unit of Chavez's administration, it is worth pondering as to whether the spikes in what should otherwise be values of attenuated changes are proof of corruption.
The spending numbers are from http://www.sisov.mpd.gov.ve; the construction numbers are from http://www.cvc.com.ve
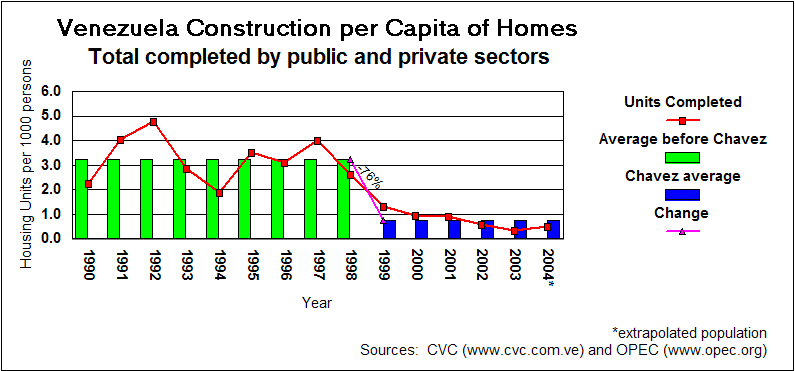
As can be seen from the long-line plot, not even during Hugo Chavez's administration's best year are more homes constructed than during the worst year of the previous administrations. Chavez's administration has been consistently completing fewer than 1.5 homes per year for every 1000 persons. For five of its six years, it has constructed fewer than one! Looking at construction numbers, instead of public spending on housing, permits analyzing results detached from intention.
The bars represent the yearly average for the nine years previous to, then for the six years of, Chavez's administration. The short-line plot emphasizes and quantifies what stands out from the bars: Chavez's administration has been completing less than one quarter the homes than preceding adminstrations.
For Chavez's 2005 administration to make up for the difference and merely match what preceeding adminstrations were achieving, it would have to increase 2004 construction by a whopping 4,974%! Unfortunately, referring back to the long-line plot, it is clear that as years go by Chavez's administration's results are decreasing an already embarrassing showing.
The construction numbers were found at http://www.cvc.com.ve; the population numbers were found at or extrapolated from http://www.opec.org.